✕
Management Login
Sign in to access your dashboard.
Username
Password
Passwords are case sensitive
Back to login
Email Address
Call
: 303-395-1782
Send Us an
Email
Newsletter
Signup
Home
About
CME Accreditation
Global Team
Vocate Education Solutions
CME Services
CME Joint Providership
Grant Strategy and Funding Support
CME Outcomes Measurement
Resources
CME Funding
CME Research
Publications
Global Guide
CME Pulse
Contact
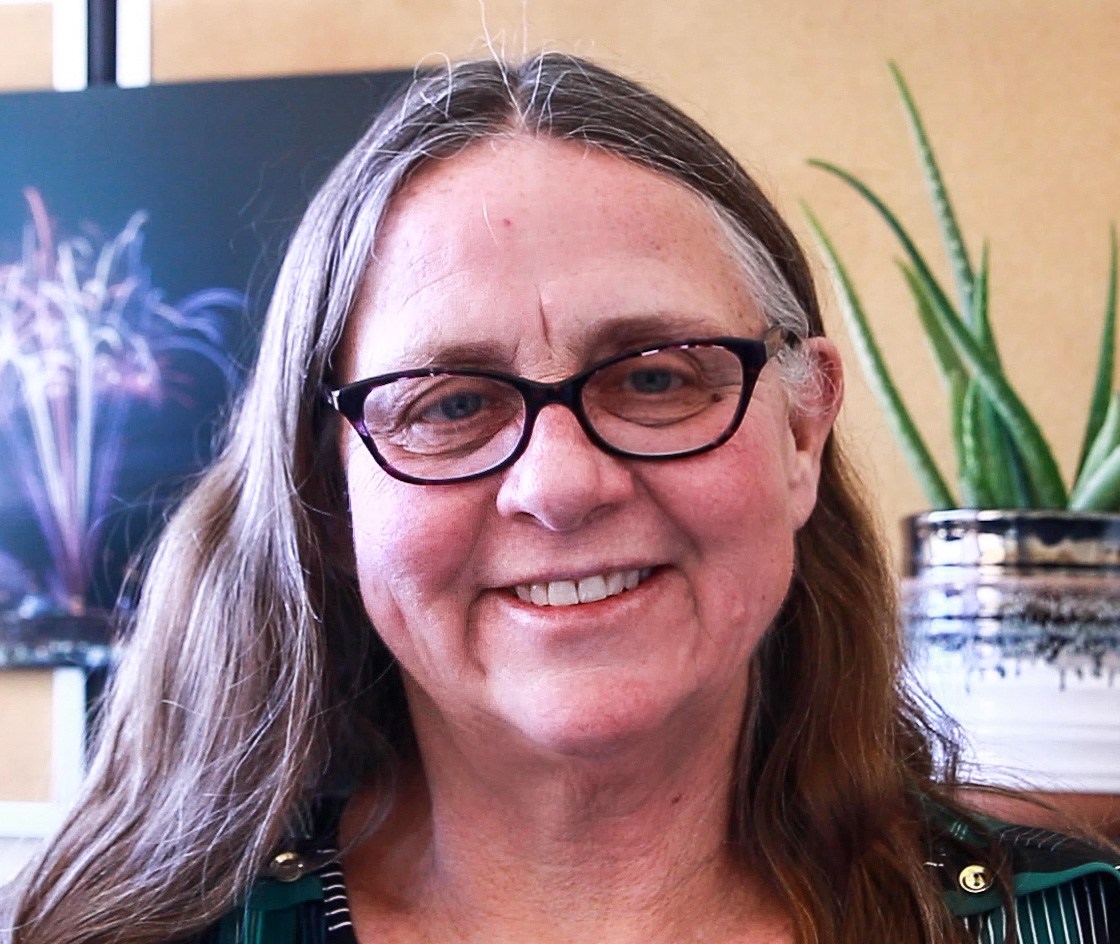
Sue's Story
Sue suffered from keratoconous for years before receiving cornea transplants. She was finally able to learn to drive at age 38.
Join Our Mailing List
×
First Name
*
Email Address
*
Submit